CENTOS7.x+ELKB6.x日志可视化构筑
ELKB:Elasticsearch+logstash+kibana+beats
官方架构说明如下图
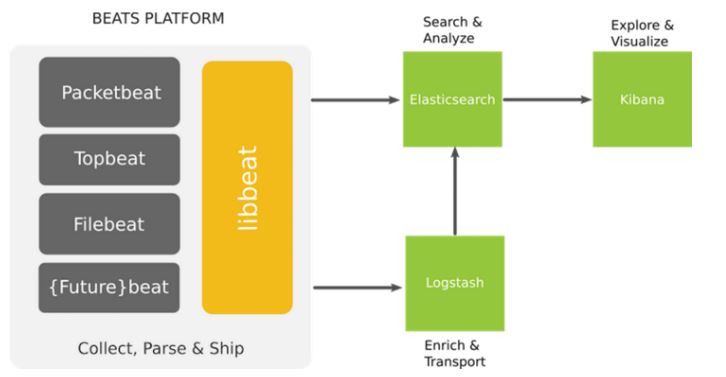
beats模块我们这次只会用到filebeat,
B安装在客户机上,ELK安装在服务端上。
Java8安装
ELK的新版本需要java8
从官方下载jdk-8u171-linux-x64.rpm
安装
# rpm -ivh jdk-8u171-linux-x64.rpm
Elasticsearch安装配置
先导入GPGkey
# rpm --import https://artifacts.elastic.co/GPG-KEY-elasticsearch
制作repo文件
# vi /etc/yum.repos.d/elastic.repo
[elasticsearch-6.x]
name=Elasticsearch repository for 6.x packages
baseurl=https://artifacts.elastic.co/packages/6.x/yum
gpgcheck=1
gpgkey=https://artifacts.elastic.co/GPG-KEY-elasticsearch
enabled=1
autorefresh=1
type=rpm-md
安装Elasticsearch
# yum install elasticsearch
编辑配置文件
# vi /etc/elasticsearch/elasticsearch.yml
network.host: localhost
启动Elasticsearch
# systemctl start elasticsearch
Kibana安装配置
安装Kibana,repo是一样的,所以直接yum
# yum install Kibana
编辑配置文件
# vi /etc/kibana/kibana.yml
server.host: "localhost"
启动kibana
# systemctl start kibana
Nginx安装配置
先导入epel的repo
# yum install epel-release
安装nginx
# yum install nginx httpd-tools
创建访问帐户,以后就是访问kibana页面的帐户密码
# htpasswd -c /etc/nginx/htpasswd.users kibanaadmin
编辑配置文件,把80端口转发至kibana的5601端口
# vi /etc/nginx/conf.d/kibana.conf
server {
    listen 80;
    server_name 192.168.0.10;
    auth_basic "Restricted Access";
    auth_basic_user_file /etc/nginx/htpasswd.users;
    location / {
        proxy_pass http://localhost:5601;
        proxy_http_version 1.1;
        proxy_set_header Upgrade $http_upgrade;
        proxy_set_header Connection 'upgrade';
        proxy_set_header Host $host;
        proxy_cache_bypass $http_upgrade;
    }
}
启动nginx
# systemctl start nginx
Logstash安装配置
安装Logstash
# yum install logstash
编辑pipline配置文件
# vi /etc/logstash/conf.d/apache.conf
input {
  beats {
    port => 5044
    type => "log"
  }
}

filter {
  grok {
    match => { "message" => "%{COMBINEDAPACHELOG}" }
  }
  geoip {
    source => "clientip"
  }
}

output {
  elasticsearch {
    hosts => "localhost:9200"
    index => "logstash-apache"
  }
}
启动logstash
# systemctl start logstash
filebeat安装配置
在客户机上进行
先导入GPGkey
# rpm --import https://artifacts.elastic.co/GPG-KEY-elasticsearch
制作repo文件
# vi /etc/yum.repos.d/elastic.repo
[elasticsearch-6.x]
name=Elasticsearch repository for 6.x packages
baseurl=https://artifacts.elastic.co/packages/6.x/yum
gpgcheck=1
gpgkey=https://artifacts.elastic.co/GPG-KEY-elasticsearch
enabled=1
autorefresh=1
type=rpm-md
安装filebeat
# yum install filebeat
编辑配置文件
# vi /etc/filebeat/filebeat.yml
#=========================== Filebeat prospectors =============================
#添加要传送的日志类型和路径,可以用通配符匹配多个文件
- type: log
  enabled: true
  paths:
    - /var/log/httpd/access_log
#================================ Outputs =====================================
#注掉elasticsearch的转发
#output.elasticsearch:
  # hosts: ["localhost:9200"]
#修改logstash的转发
output.logstash:
  hosts: ["192.168.0.10:5044"]
启动filebeat
# systemctl start filebeat
kibana页面配置
打开http://192.168.0.10
输入上面创建的帐号密码
点击右下角的IndexPatterns
Index pattern里面输入logstash-*,下一步
Time Filter field name选@timestamp,完成。
左边菜单点discover,看到日志已经获取到了。
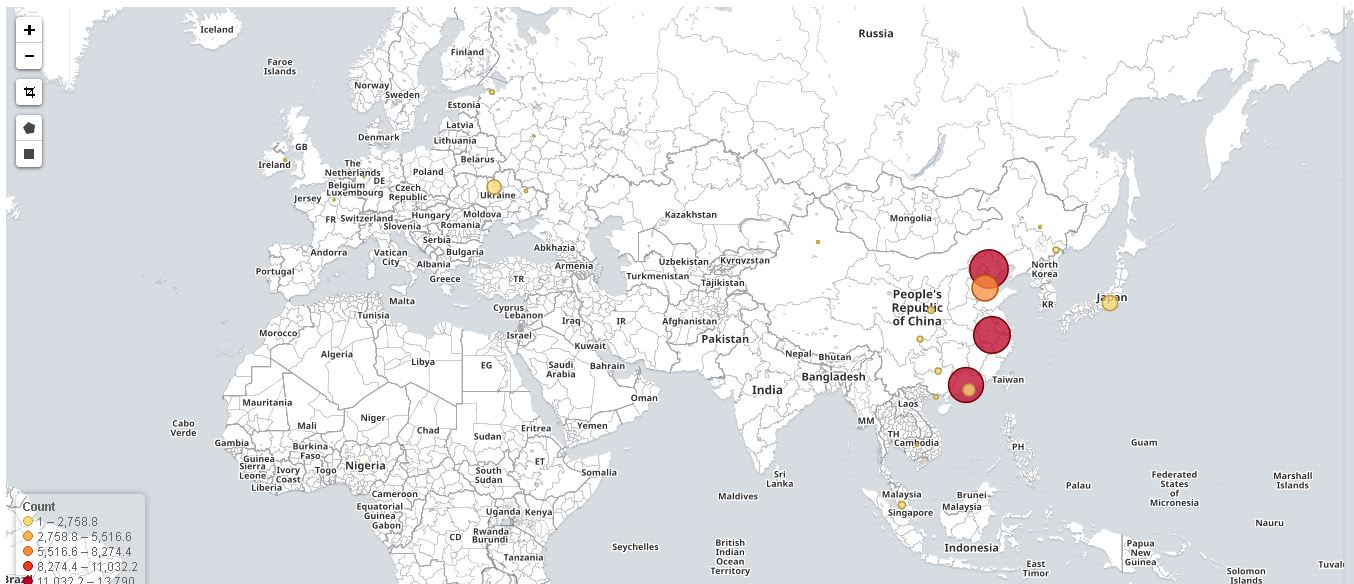
左边菜单点visualize,选择coordinatemap,选择logstash-*,
Metrics里不用改,Buckets里点Geo Coordinates,
Aggregation选Geohash,Field里选geoip.location,
点击上面的applychanges三角形,点击save
左边菜单点dashboard,点击add,选择刚才保存的visualization,
点击save,就可以用来展示了。
其他
用高德地图
# vi /etc/kibana/kibana.yml
tilemap.url: "http://webrd01.is.autonavi.com/appmaptile?lang=zh_cn&size=1&scale=1&style=8&x={x}&y={y}&z={z}"
高德地图做visualize的时候最开始会显示白屏,
点击一下地图上的+号键就好了,不知道为什么。
elasticsearch查看index列表
# curl 'localhost:9200/_cat/indices?v'
原创文章,转载请注明出处!
本文链接:https://justbio.github.io//posts/Centos7-ELKB.html